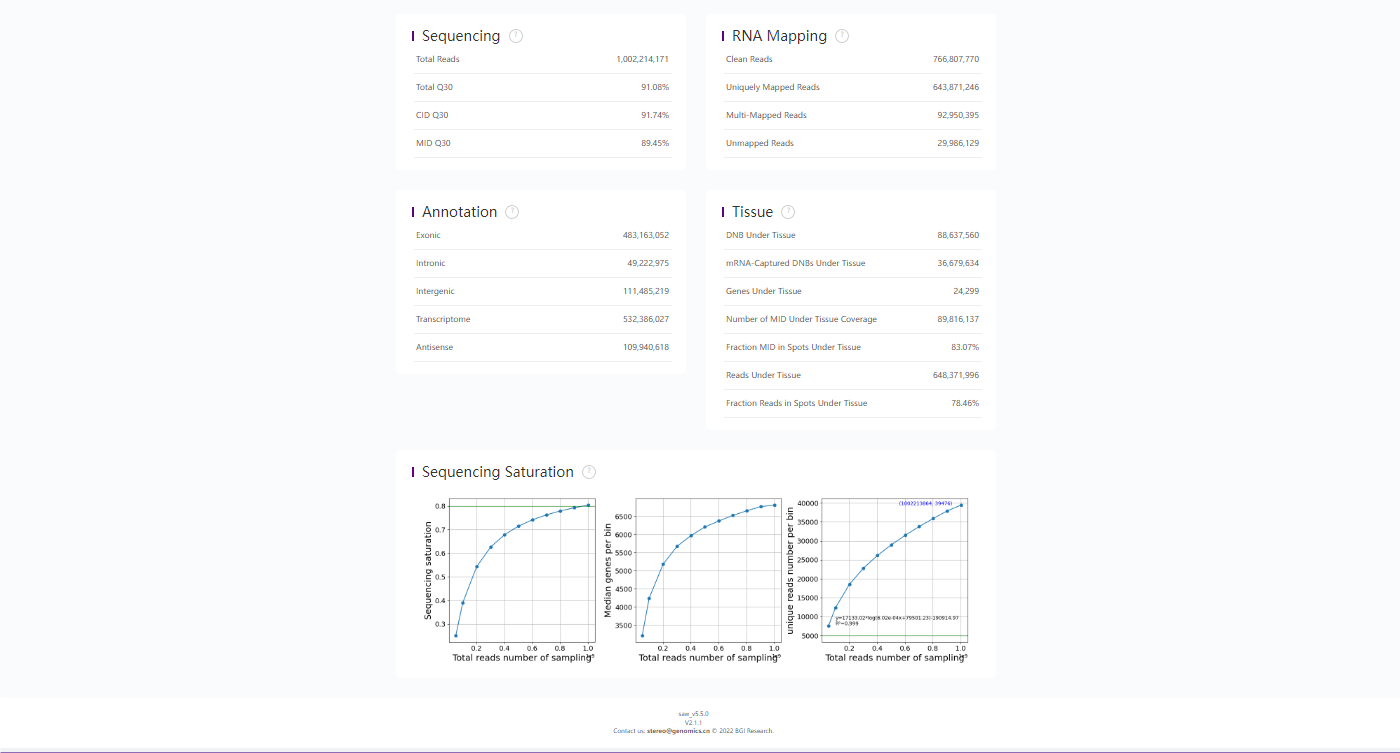
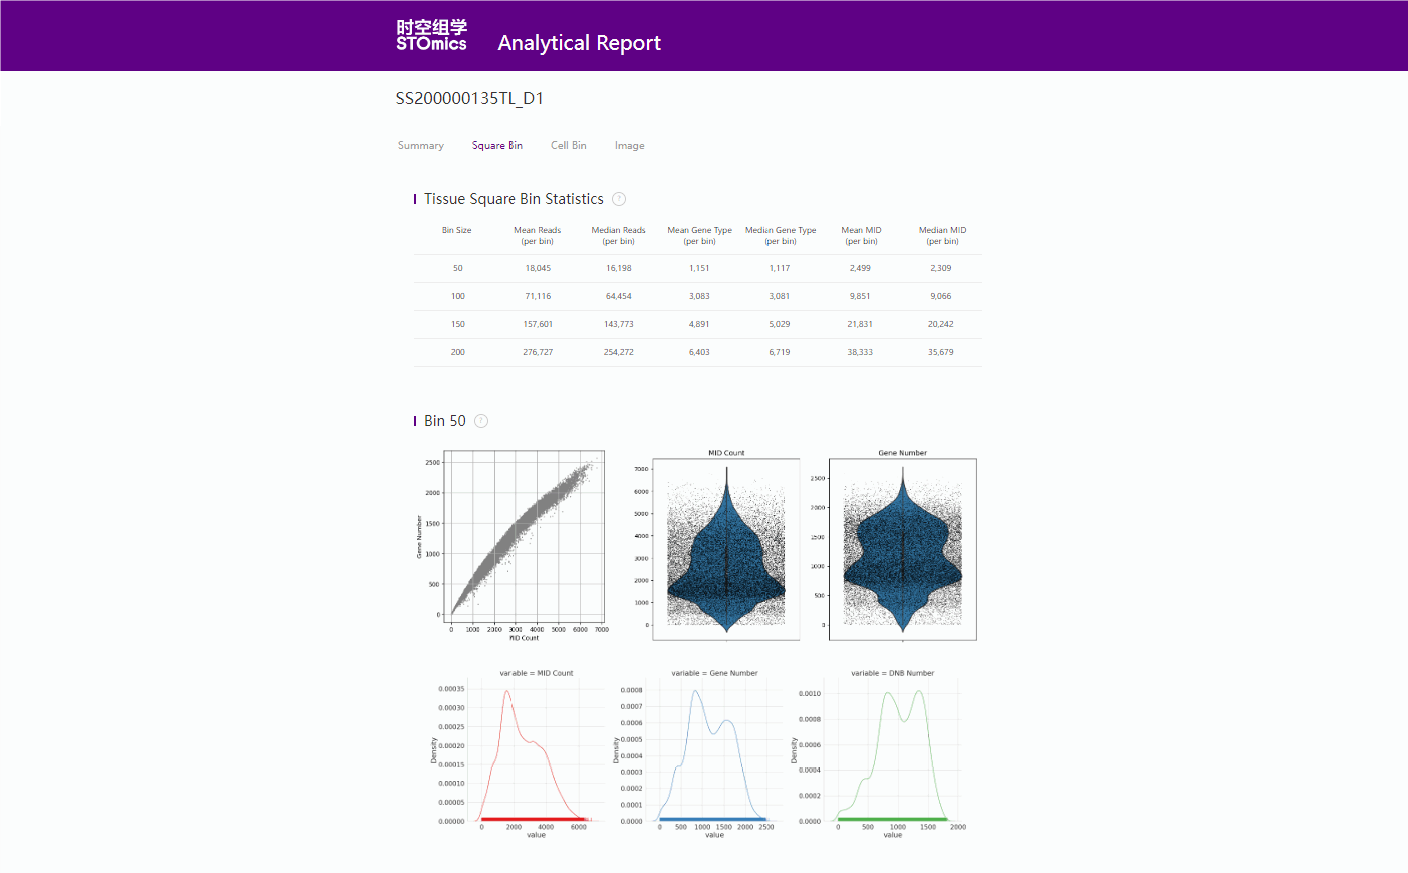
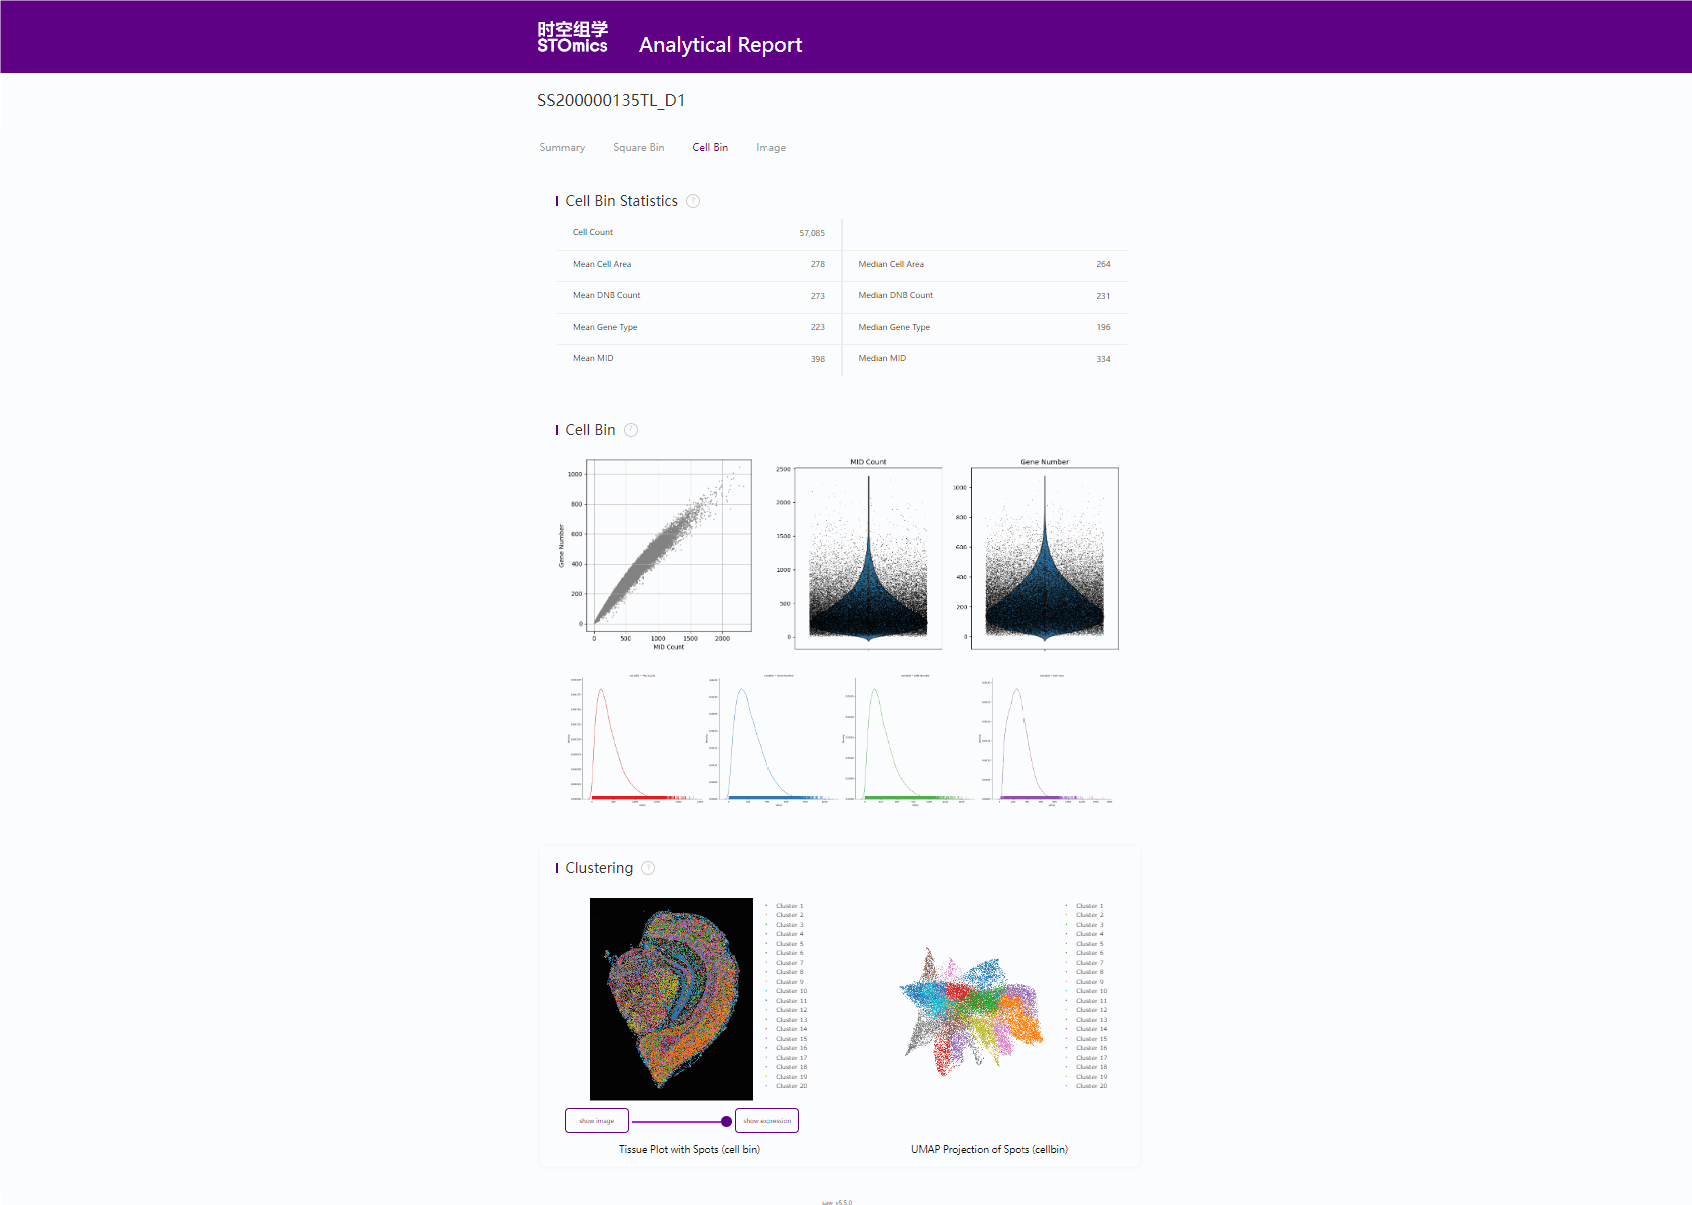
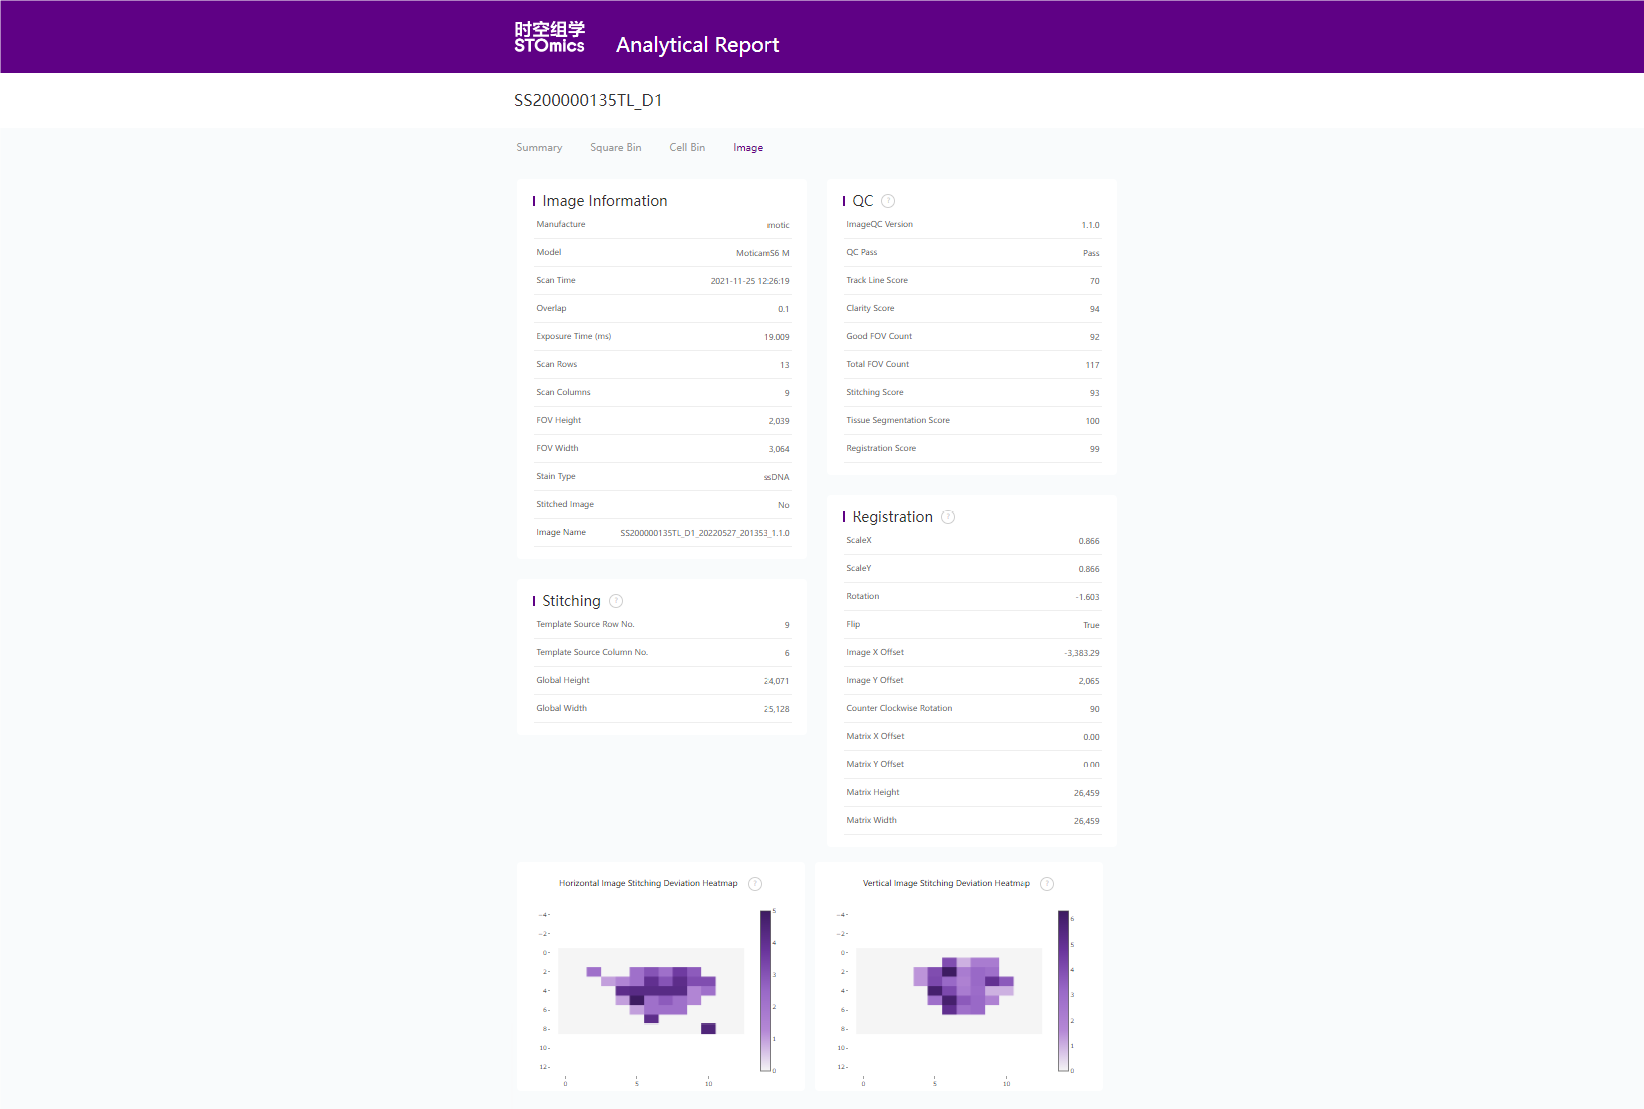
1. mapping
1.1 CID匹配和过滤统计结果
bash
$ cat /path/to/output/01.mapping/E100026571_L01_trim_read_1.CIDMap.stat
...
                        unique_CID_in_mask:        645784920
                          unique_CID_in_fq:        78021796
                               total_reads:        1002214171
                          CID_with_N_reads:        8031                0.00  %
                          CID_mapped_reads:        845113606           84.32 %
                  CID_exactly_mapped_reads:        698277934           69.67 %
            CID_mapped_reads_with_mismatch:        146827641           14.65 %
                       discarded_MID_reads:        8451158             0.84  %
                          MID_with_N_reads:        13339               0.00  %
                      MID_with_polyA_reads:        13044               0.00  %
           MID_with_low_quality_base_reads:        8424775             0.84  %
                            reads_with_dnb:        45281336            4.52  %
                        reads_with_adapter:        8136836             0.81  %
           short_reads_filtered_with_polyA:        14191622            1.42  %
                          reads_with_polyA:        105849530           10.56 %
                           reads_with_rRNA:        0                   0.00  %
                          Q10_bases_in_seq:        99.47 %
                          Q20_bases_in_seq:        97.12 %
                          Q30_bases_in_seq:        91.08 %
                          Q10_bases_in_MID:        99.26 %
                          Q20_bases_in_MID:        96.32 %
                          Q30_bases_in_MID:        89.45 %
                          Q10_bases_in_CID:        99.54 %
                          Q20_bases_in_CID:        97.49 %
Q30_bases_in_CID:        91.74 %
1.2 参考基因组比对统计
bash
$ cat /path/to/output/01.mapping/E100026571_L01_trim_read_1.Log.final.out
...
                          Number of input reads |        769052654
                      Average input read length |        95
                                    UNIQUE READS:
                   Uniquely mapped reads number |        645319822
                        Uniquely mapped reads % |        83.91%
                          Average mapped length |        95.14
                       Number of splices: Total |        67634124
            Number of splices: Annotated (sjdb) |        65711163
                       Number of splices: GT/AG |        66445242
                       Number of splices: GC/AG |        457783
                       Number of splices: AT/AC |        41573
               Number of splices: Non-canonical |        689526
                      Mismatch rate per base, % |        0.50%
                         Deletion rate per base |        0.07%
                        Deletion average length |        3.91
                        Insertion rate per base |        0.03%
                       Insertion average length |        1.25
                             MULTI-MAPPING READS:
        Number of reads mapped to multiple loci |        87828411
             % of reads mapped to multiple loci |        11.42%
        Number of reads mapped to too many loci |        5333051
             % of reads mapped to too many loci |        0.69%
                                  UNMAPPED READS:
  Number of reads unmapped: too many mismatches |        0
       % of reads unmapped: too many mismatches |        0.00%
            Number of reads unmapped: too short |        29365488
                 % of reads unmapped: too short |        3.82%
                Number of reads unmapped: other |        1205882
                     % of reads unmapped: other |        0.16%
                                  CHIMERIC READS:
                       Number of chimeric reads |        0
% of chimeric reads |        0.00%
1.3 mapping BAM示例
bash
$ samtools view
/path/to/output/01.mapping/E100026571_L01_trim_read_1.Aligned.sortedByCoord.out.bam | head -2
E100026571L1C007R00303973559    256     1       3000644 3       100M    *       0       0
GCCTCATTGTGCCCCATATGTTTGCCTATGTTGTGGACTTATTTTCATTAAACTTTAAAACATCTTTAATTTTTTTCTTTATTTCATCATTGACCAAGCT
-FCA9D?GFFD<-DF;EG,G?
NH:i:2  HI:i:2  AS:i:94 nM:i:2 Cx:i:8839        Cy:i:7539       UR:Z:120CF
E100026571L1C003R03702347721    0       1       3001778 255     100M    *       0       0
GTATGACATCTGTCCAGGATCTTCTAGCTTTCATAGTCTCTGGTGAGAAGTCTGGAGTAATTCTAATAGGCCTGCATTTATATGTTACTTGACCTTTTTC
EEFEDFFEFFFFEFFFFEC@EFFFFDFFEEFFEFFFFCFCEFFAFBFCED??FGBEFFDC:FFFDCFAF4FAFFDFFDG?DFBD.F@FECA/FEDEFFAA
NH:i:1  HI:i:1  AS:i:92 nM:i:3 Cx:i:12136       Cy:i:14034      UR:Z:C0808
2. merge
2.1 CID对应reads数列表示例
bash
$ head /path/to/output/02.merge/SS200000135TL_D1.merge.barcodeReadsCount.txt
7127    18002   48
4348    19028   1
14130   8635    1
7618    14537   24
4912    10945   5
16783   12914   1
15539   8177    1
9288    8082    14
7274    16533   59
9087    10657   10
3. count
3.1 MID过滤和基因注释结果统计
$ cat /path/to/output/03.count/SS200000135TL_D1.Aligned.sortedByCoord.out.merge.q10.dedup.target.bam.summary.stat
## FILTER & DEDUPLICATION METRICS
TOTAL_READS     PASS_FILTER     ANNOTATED_READS UNIQUE_READS    FAIL_FILTER_RATE        FAIL_ANNOTATE_RATE      DUPLICATION_RATE
733148233       645319822       533743961       108363128       11.98                   17.29                   79.70
## ANNOTATION METRICS
TOTAL_READS     MAP             EXONIC          INTRONIC        INTERGENIC      TRANSCRIPTOME   ANTISENSE
645319822       645319822       484480416       49263545        111575861       533743961       110185975
100.0           100.0           75.1            7.6             17.3            82.7            17.1
3.2 注释结果BAM示例
$ samtools view /path/to/output/03.count/SS200000135TL_D1.Aligned.sortedByCoord.out.merge.q10.dedup.target.bam | head -2
E100026571L1C007R00303973559    768     1       3000644 3       100M    *       0       0       GCCTCATTGTGCCCCATATGTTTGCCTATGTTGTGGACTTATTTTCATTAAACTTTAAAACATCTTTAATTTTTTTCTTTATTTCATCATTGACCAAGCT    -FCA9D?GFFD<-D<CGFEGD-DG*FGFDFBE;E(9BGGE38FFFG9GG;0?GGFGB?E@G:GGG3GF79F0GGDG?G<D>F;EG,G?<<CD4>G=>B+C    NH:i:2  HI:i:1  AS:i:94 nM:i:2  Cx:i:8839       Cy:i:7539       UR:Z:120CF
E100026571L1C003R03702347721    0       1       3001778 255     100M    *       0       0       GTATGACATCTGTCCAGGATCTTCTAGCTTTCATAGTCTCTGGTGAGAAGTCTGGAGTAATTCTAATAGGCCTGCATTTATATGTTACTTGACCTTTTTC    EEFEDFFEFFFFEFFFFEC@EFFFFDFFEEFFEFFFFCFCEFFAFBFCED??FGBEFFDC:FFFDCFAF4FAFFDFFDG?DFBD.F@FECA/FEDEFFAA    NH:i:1  HI:i:1  AS:i:92 nM:i:3  Cx:i:12136      Cy:i:14034      UR:Z:C0808      XF:i:2
3.3 count基因表达文件示例
bash
$ h5dump -n /path/to/output/03.count/SS200000135TL_D1.raw.gef
HDF5 "/path/to/output/03.count/SS200000135TL_D1.raw.gef" {
FILE_CONTENTS {
 group      /
 group      /geneExp
 group      /geneExp/bin1
 dataset    /geneExp/bin1/exon
 dataset    /geneExp/bin1/expression
 dataset    /geneExp/bin1/gene
 }
}

$ h5dump -d /geneExp/bin1/expression  /path/to/output/03.count/SS200000135TL_D1.raw.gef | head -15
HDF5 "/path/to/output/03.count/SS200000135TL_D1.raw.gef" {
DATASET "/geneExp/bin1/expression" {
   DATATYPE  H5T_COMPOUND {
      H5T_STD_U32LE "x";
      H5T_STD_U32LE "y";
      H5T_STD_U8LE "count";
   }
   DATASPACE  SIMPLE { ( 76210618 ) / ( 76210618 ) }
   DATA {
   (0): {
         636,
         12671,
         2
      },
   (1): {

$ h5dump -d /geneExp/bin1/gene /path/to/output/03.count/SS200000135TL_D1.raw.gef | head -20
HDF5 "/path/to/output/03.count/SS200000135TL_D1.raw.gef" {
DATASET "/geneExp/bin1/gene" {
   DATATYPE  H5T_COMPOUND {
      H5T_STRING {
         STRSIZE 64;
         STRPAD H5T_STR_NULLTERM;
         CSET H5T_CSET_ASCII;
         CTYPE H5T_C_S1;
      } "gene";
      H5T_STD_U32LE "offset";
      H5T_STD_U32LE "count";
   }
   DATASPACE  SIMPLE { ( 24670 ) / ( 24670 ) }
   DATA {
   (0): {
         "0610005C13Rik",
         0,
         45
      },
   (1): {
3.4 count抽样文件
bash
$ head -8 /path/to/output/03.count/SS200000135TL_D1_raw_barcode_gene_exp.txt
x y geneIndex MIDIndex readCount
9602 7705 10551 611723 2
4888 10392 10551 665954 4
8901 7096 10551 881671 1
8901 7096 10551 357383 20
7397 18783 10551 355789 1
9155 13032 10551 297666 1
9155 13032 10551 298690 1
4. register and imageTools
4.1 配准图
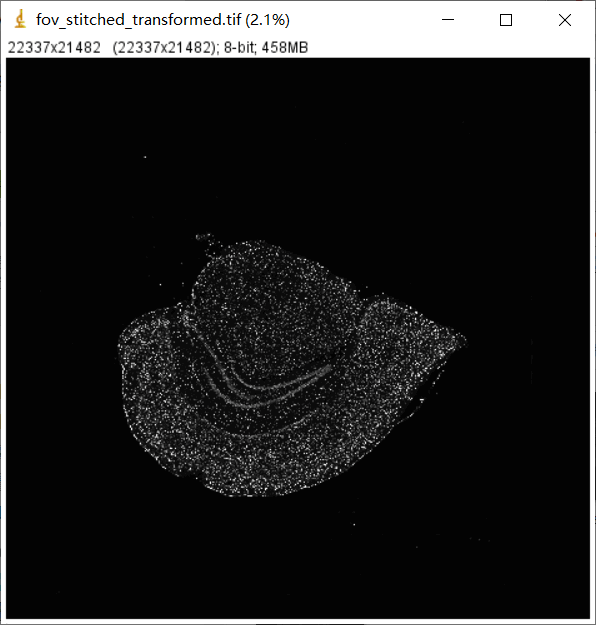
文件: /path/to/output/04.register/ssDNA_fov_stitched_transformed.tif和/path/to/output/04.register/ssDNA_SS200000135TL_D1_regist.tif
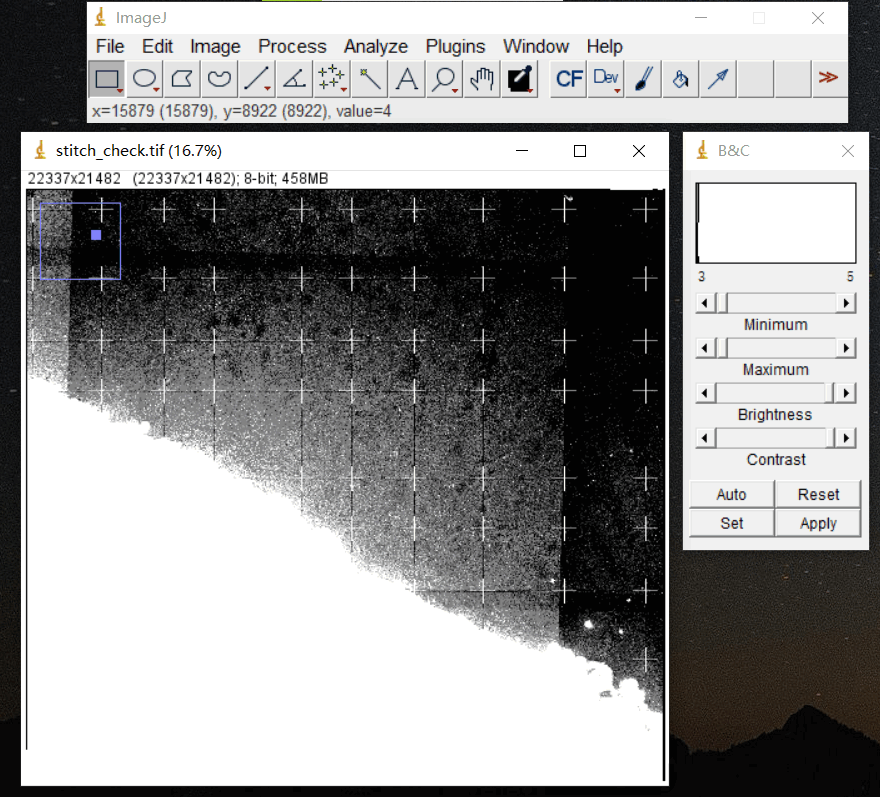
./path/to/output/04.register/ssDNA_fov_stitched_transformed.tif
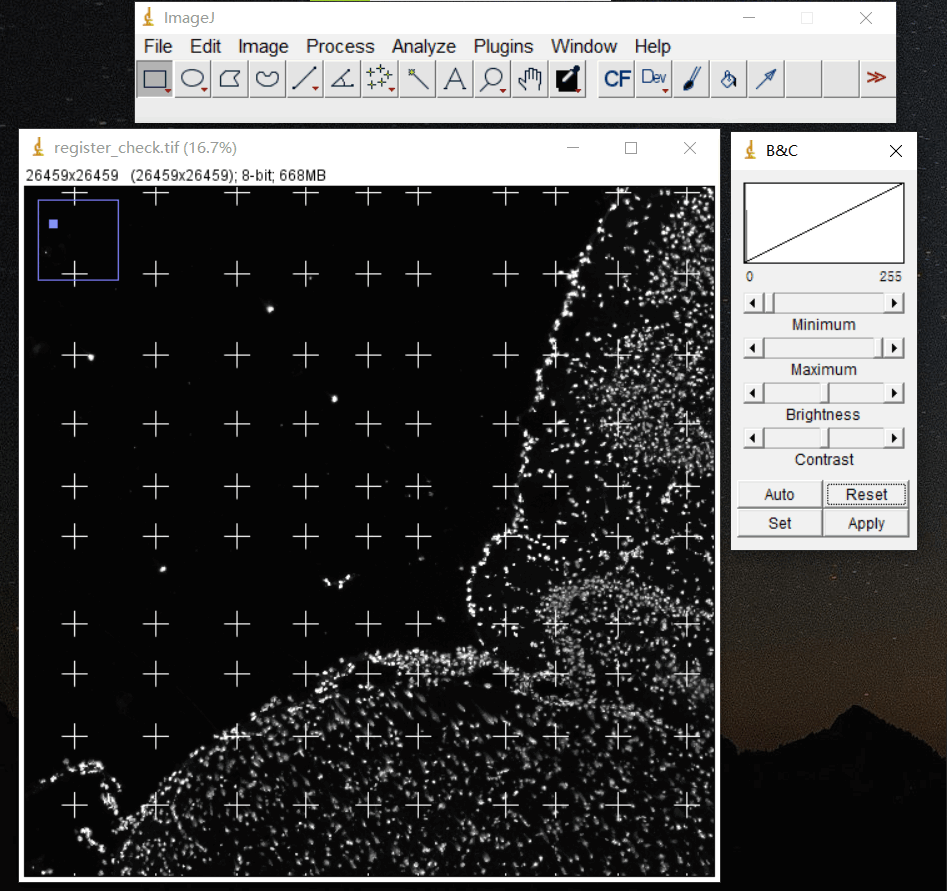
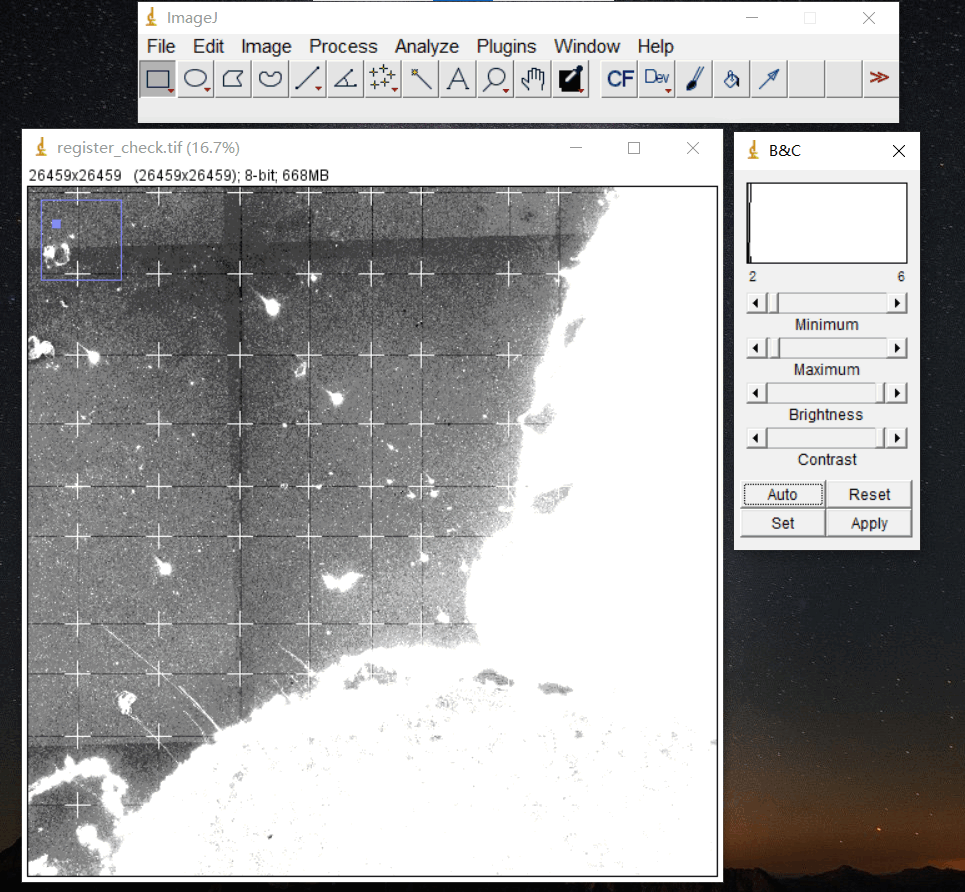
/path/to/output/04.register/ssDNA_SS200000135TL_D1_regist.tif
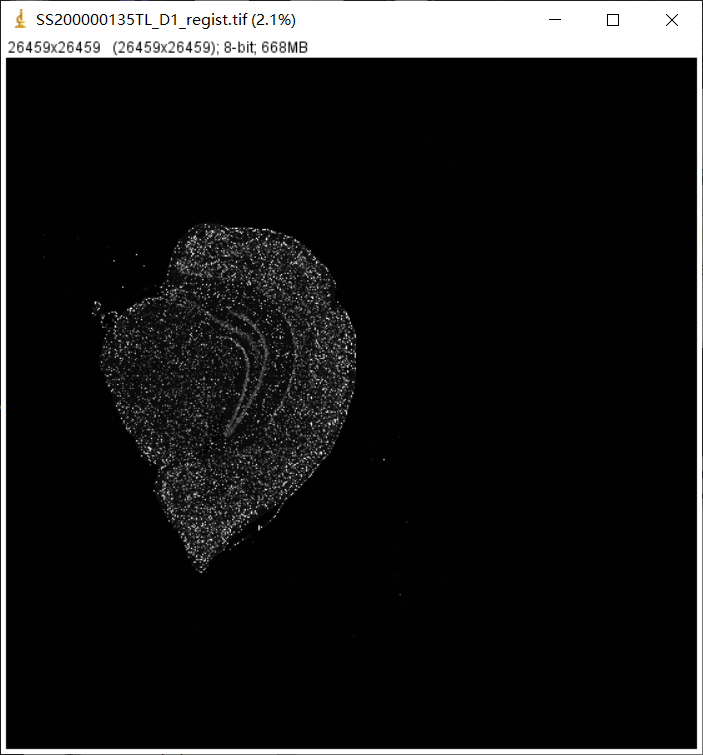
4.2 图像处理过程记录文件
bash
$ h5dump -n /path/to/output/04.register/SS200000135TL_D1_20230822_144400_3.0.0.ipr
HDF5 "/path/to/output/04.register/SS200000135TL_D1_20220527_201353_1.1.0.ipr" {
FILE_CONTENTS {
 group      /
 group      /ManualState
 dataset    /Preview
 group      /StereoResepSwitch
 group      /ssDNA
 group      /ssDNA/CellSeg
 dataset    /ssDNA/CellSeg/CellMask
 dataset    /ssDNA/CellSeg/CellSegTrace
 group      /ssDNA/ImageInfo
 dataset    /ssDNA/ImageInfo/RGBScale
 group      /ssDNA/QCInfo
 group      /ssDNA/QCInfo/CrossPoints
 dataset    /ssDNA/QCInfo/CrossPoints/0_0
 ...
 dataset    /ssDNA/QCInfo/CrossPoints/9_8
 group      /ssDNA/Register
 dataset    /ssDNA/Register/MatrixTemplate
 group      /ssDNA/Stitch
 group      /ssDNA/Stitch/ScopeStitch
 dataset    /ssDNA/Stitch/ScopeStitch/GlobalLoc
 dataset    /ssDNA/Stitch/ScopeStitch/ScopeHorizontalJitter
 dataset    /ssDNA/Stitch/ScopeStitch/ScopeJitterDiff
 dataset    /ssDNA/Stitch/ScopeStitch/ScopeVerticalJitter
 group      /ssDNA/Stitch/StitchEval
 dataset    /ssDNA/Stitch/StitchEval/GlobalDeviation
 dataset    /ssDNA/Stitch/StitchEval/StitchEvalH
 dataset    /ssDNA/Stitch/StitchEval/StitchEvalV
 dataset    /ssDNA/Stitch/TemplatePoint
 dataset    /ssDNA/Stitch/TransformTemplate
 group      /ssDNA/TissueSeg
 dataset    /ssDNA/TissueSeg/TissueMask
 }
}

$ h5dump -A /path/to/output/04.register/SS200000135TL_D1_20230822_144400_3.0.0.ipr | head -20
HDF5 "/path/to/output/04.register/SS200000135TL_D1_20220527_201353_1.1.0.ipr" {
GROUP "/" {
   ATTRIBUTE "IPRVersion" {
      DATATYPE  H5T_STRING {
         STRSIZE H5T_VARIABLE;
         STRPAD H5T_STR_NULLTERM;
         CSET H5T_CSET_UTF8;
         CTYPE H5T_C_S1;
      }
      DATASPACE  SCALAR
      DATA {
      (0): "0.2.0"
      }
   }
   GROUP "ManualState" {
      ATTRIBUTE "calibration" {
         DATATYPE  H5T_ENUM {
            H5T_STD_I8LE;
            "FALSE"            0;
            "TRUE"             1;
4.3 ImageTools merge
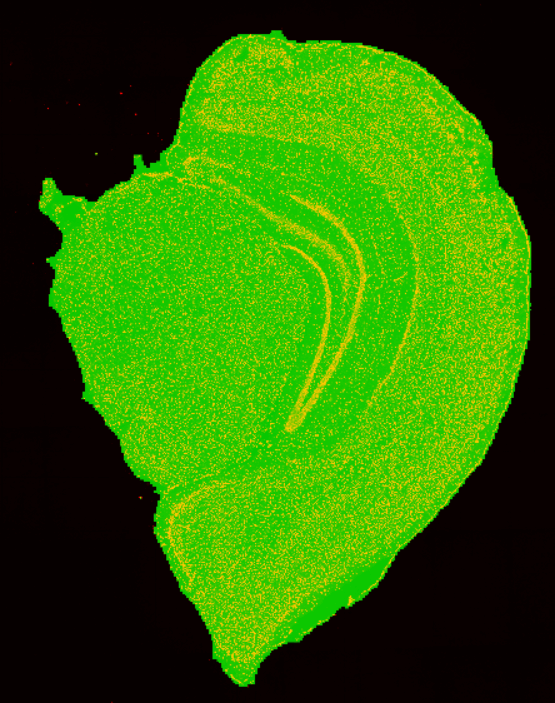
显微镜图像 ssDNA_SS200000135TL_D1_regist.tif和组织分割二值化掩膜文件ssDNA_SS200000135TL_D1_tissue_cut.tif 进行融合,来检查组织分割的结果。
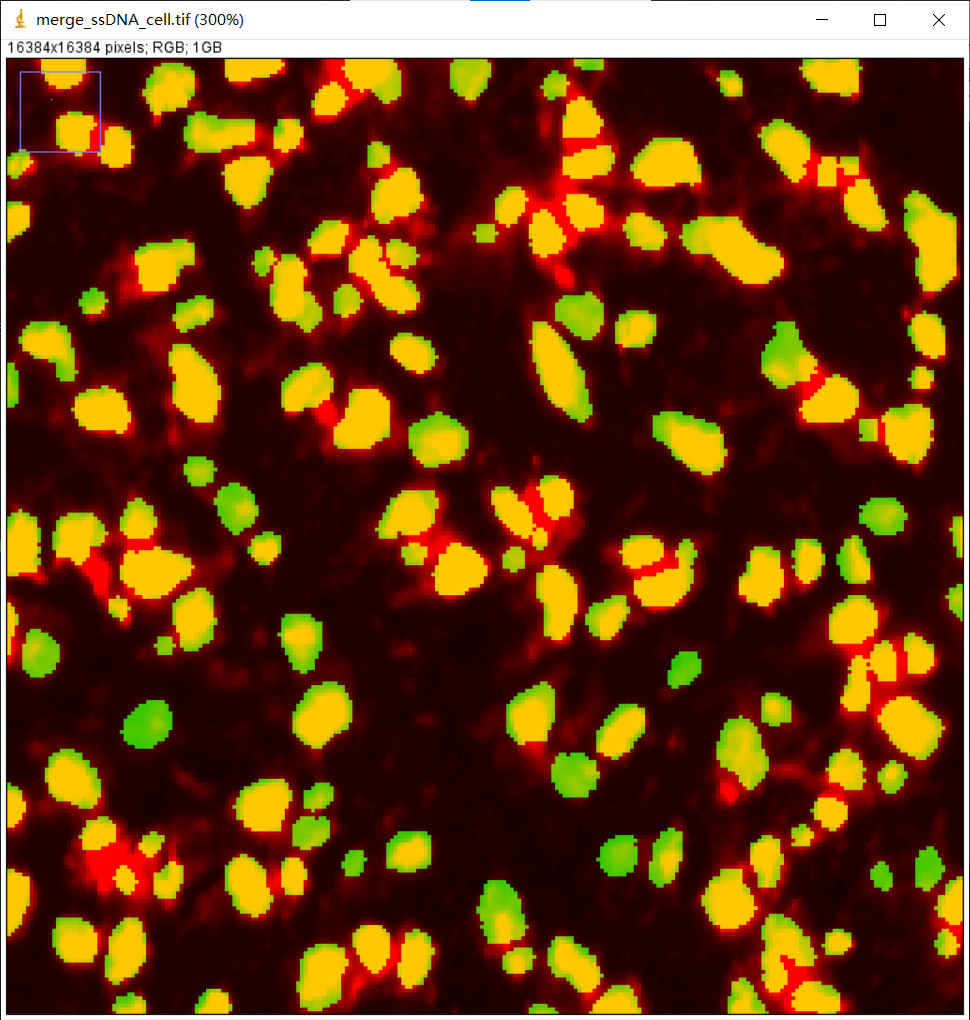
显微图像ssDNA_SS200000135TL_D1_regist.tif 和细胞分割文件ssDNA_SS200000135TL_D1_mask.tif 进行部分融合,来检查细胞分割的结果。
4.4 ImageTools overlay
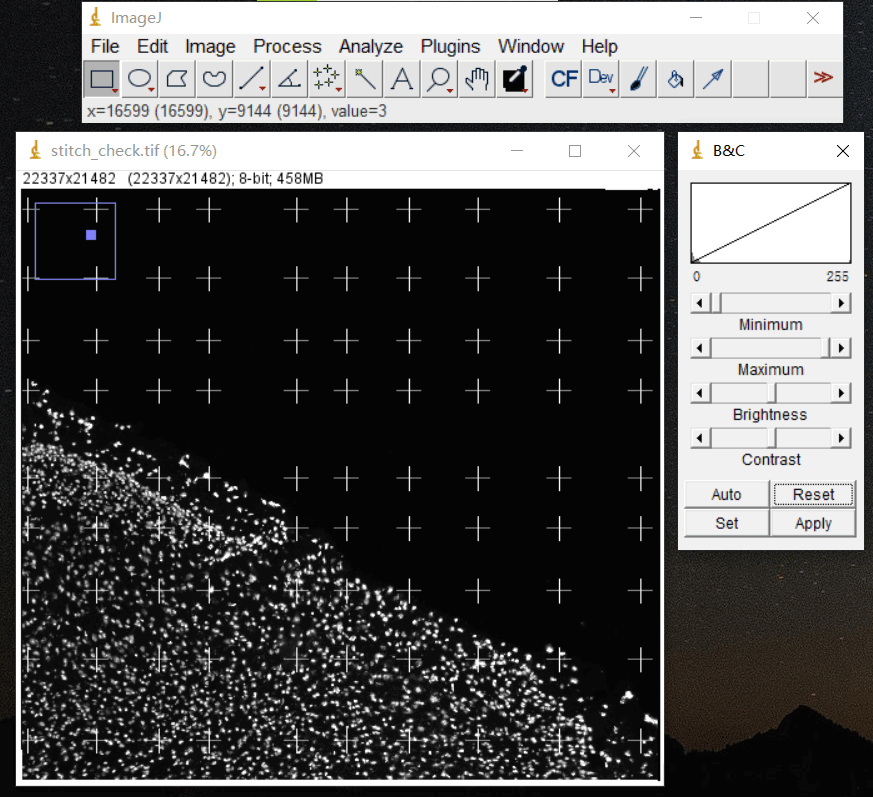
在 ssDNA_fov_stitched_transformed.tif 文件上叠加拼接模板来检查拼接的效果。
在 ssDNA_SS200000135TL_D1_regist.tif文件上叠加配准模板来检查配准的效果。
5. tissueCut
5.1 组织覆盖区域统计分析
bash
$ cat /path/to/output/05.tissuecut/tissuecut.stat
# Tissue Statistic Analysis with Stain ImageContour_area: 87086375
Number_of_DNB_under_tissue: 36521212
Ratio: 41.94%
Total_gene_type: 24289
MID_counts: 89679129
Fraction_MID_in_spots_under_tissue: 82.76%
Reads_under_tissue: 709807297
Fraction_reads_in_spots_under_tissue: 83.99%

binSize=1
Mean_reads_per_spot: 15.10
Median_reads_per_spot: 9.00
Mean_gene_type_per_spot: 1.71
Median_gene_type_per_spot: 1
Mean_Umi_per_spot: 2.46
Median_Umi_per_spot: 2

binSize=20
Mean_reads_per_spot: 3241.11
Median_reads_per_spot: 2782.00
Mean_gene_type_per_spot: 241.08
Median_gene_type_per_spot: 227
Mean_Umi_per_spot: 409.56
Median_Umi_per_spot: 370

binSize=50
Mean_reads_per_spot: 20054.45
Median_reads_per_spot: 18285.00
Mean_gene_type_per_spot: 1165.56
Median_gene_type_per_spot: 1133
Mean_Umi_per_spot: 2534.10
Median_Umi_per_spot: 2346

binSize=100
Mean_reads_per_spot: 78867.48
Median_reads_per_spot: 72545.00
Mean_gene_type_per_spot: 3110.83
Median_gene_type_per_spot: 3117
Mean_Umi_per_spot: 9964.35
Median_Umi_per_spot: 9205

binSize=150
Mean_reads_per_spot: 174614.34
Median_reads_per_spot: 162073.00
Mean_gene_type_per_spot: 4926.51
Median_gene_type_per_spot: 5065
Mean_Umi_per_spot: 22066.71
Median_Umi_per_spot: 20430

binSize=200
Mean_reads_per_spot: 305687.91
Median_reads_per_spot: 285723.00
Mean_gene_type_per_spot: 6424.38
Median_gene_type_per_spot: 6747
Mean_Umi_per_spot: 38621.50
Median_Umi_per_spot: 36060
5.2 组织覆盖区域基因表达矩阵示例
bash
$ h5dump -n /path/to/output/05.tissuecut/SS200000135TL_D1.tissue.gef
HDF5 "/path/to/output/05.tissuecut/SS200000135TL_D1.tissue.gef" {
FILE_CONTENTS {
 group      /
 group      /geneExp
 group      /geneExp/bin1
 dataset    /geneExp/bin1/exon
 dataset    /geneExp/bin1/expression
 dataset    /geneExp/bin1/gene
 }
}

$ h5dump -d /geneExp/bin1/expression /path/to/output/05.tissuecut/SS200000135TL_D1.tissue.gef | head -15
HDF5 "/path/to/output/05.tissuecut/SS200000135TL_D1.tissue.gef" {
DATASET "/geneExp/bin1/expression" {
   DATATYPE  H5T_COMPOUND {
      H5T_STD_U32LE "x";
      H5T_STD_U32LE "y";
      H5T_STD_U8LE "count";
   }
   DATASPACE  SIMPLE { ( 62542665 ) / ( 62542665 ) }
   DATA {
   (0): {
         6148,
         10906,
         1
      },
   (1): {

$ h5dump -d /geneExp/bin1/gene /path/to/output/05.tissuecut/SS200000135TL_D1.tissue.gef | head -20
HDF5 "/path/to/output/05.tissuecut/SS200000135TL_D1.tissue.gef" {
DATASET "/geneExp/bin1/gene" {
   DATATYPE  H5T_COMPOUND {
      H5T_STRING {
         STRSIZE 64;
         STRPAD H5T_STR_NULLTERM;
         CSET H5T_CSET_ASCII;
         CTYPE H5T_C_S1;
      } "gene";
      H5T_STD_U32LE "offset";
      H5T_STD_U32LE "count";
   }
   DATASPACE  SIMPLE { ( 24289 ) / ( 24289 ) }
   DATA {
   (0): {
         "0610005C13Rik",
         0,
         24
      },
   (1): {
5.3 补全GEF的基因表达矩阵示例
bash
$ h5dump -n /path/to/output/02.count/SS200000135TL_D1.gef
HDF5 "/path/to/output/05.tissuecut/SS200000135TL_D1.gef" {
FILE_CONTENTS {
 group      /
 group      /geneExp
 group      /geneExp/bin1
 dataset    /geneExp/bin1/exon
 dataset    /geneExp/bin1/expression
 dataset    /geneExp/bin1/gene
 group      /geneExp/bin10
 dataset    /geneExp/bin10/exon
 dataset    /geneExp/bin10/expression
 dataset    /geneExp/bin10/gene
 group      /geneExp/bin100
 dataset    /geneExp/bin100/exon
 dataset    /geneExp/bin100/expression
 dataset    /geneExp/bin100/gene
 group      /geneExp/bin20
 dataset    /geneExp/bin20/exon
 dataset    /geneExp/bin20/expression
 dataset    /geneExp/bin20/gene
 group      /geneExp/bin200
 dataset    /geneExp/bin200/exon
 dataset    /geneExp/bin200/expression
 dataset    /geneExp/bin200/gene
 group      /geneExp/bin50
 dataset    /geneExp/bin50/exon
 dataset    /geneExp/bin50/expression
 dataset    /geneExp/bin50/gene
 group      /geneExp/bin500
 dataset    /geneExp/bin500/exon
 dataset    /geneExp/bin500/expression
 dataset    /geneExp/bin500/gene
 group      /stat
 dataset    /stat/gene
 group      /wholeExp
 dataset    /wholeExp/bin1
 dataset    /wholeExp/bin10
 dataset    /wholeExp/bin100
 dataset    /wholeExp/bin20
 dataset    /wholeExp/bin200
 dataset    /wholeExp/bin50
 dataset    /wholeExp/bin500
 group      /wholeExpExon
 dataset    /wholeExpExon/bin1
 dataset    /wholeExpExon/bin10
 dataset    /wholeExpExon/bin100
 dataset    /wholeExpExon/bin20
 dataset    /wholeExpExon/bin200
 dataset    /wholeExpExon/bin50
 dataset    /wholeExpExon/bin500
 }
}

$ h5dump -d /stat/gene /path/to/output/05.tissuecut/SS200000135TL_D1.gef | head -20
HDF5 "/path/to/output/05.tissuecut/SS200000135TL_D1.gef" {
DATASET "/stat/gene" {
   DATATYPE  H5T_COMPOUND {
      H5T_STRING {
         STRSIZE 64;
         STRPAD H5T_STR_NULLTERM;
         CSET H5T_CSET_ASCII;
         CTYPE H5T_C_S1;
      } "gene";
      H5T_STD_U32LE "MIDcount";
      H5T_IEEE_F32LE "E10";
   }
   DATASPACE  SIMPLE { ( 24670 ) / ( 24670 ) }
   DATA {
   (0): {
         "Gm42418",
         5860952,
         60.1028
      },
   (1): {
6. cellCut
6.1 cell bin 基因表达矩阵示例
bash
$ h5dump -n /path/to/output/051.cellcut/SS200000135TL_D1.cellbin.gef
HDF5 "/path/to/output/051.cellcut/SS200000135TL_D1.cellbin.gef" {
FILE_CONTENTS {
 group      /
 group      /cellBin
 dataset    /cellBin/blockIndex
 dataset    /cellBin/blockSize
 dataset    /cellBin/cell
 dataset    /cellBin/cellBorder
 dataset    /cellBin/cellExon
 dataset    /cellBin/cellExp
 dataset    /cellBin/cellExpExon
 dataset    /cellBin/cellTypeList
 dataset    /cellBin/gene
 dataset    /cellBin/geneExon
 dataset    /cellBin/geneExp
 dataset    /cellBin/geneExpExon
 }
}
7. 测序饱和度文件示例
bash
$ cat /path/to/output/07.saturation/sequence_saturation.tsv
sample  bar_x   bar_y1  bar_y2  bar_umi bin_x   bin_y1  bin_y2  bin_umi
0.05    26687198        0.250475        1       20002730        26687198        0.273744        3030    7041
0.1     53374396        0.389862        1       32565765        53374396        0.409615        4045    11464
0.2     106748792       0.542456        1       48842313        106748792       0.557064        4962    17194
0.3     160123200       0.625182        1       60017028        160123200       0.636707        5435    21128
0.4     213497584       0.677501        1       68852648        213497584       0.6871          5778    24238
0.5     266871984       0.713814        1       76374913        266871984       0.722081        6052    26886
0.6     320246400       0.740741        1       83026752        320246400       0.748035        6234    29228
0.7     373620768       0.761599        1       89071589        373620768       0.768155        6381    31356
0.8     426995168       0.778242        1       94689701        426995168       0.784222        6528    33334
0.9     480369568       0.79188         1       99974373        480369568       0.797395        6639    35194
1       533743961       0.803326        1       104973406       533743961       0.808462        6718    36641
8. 报告
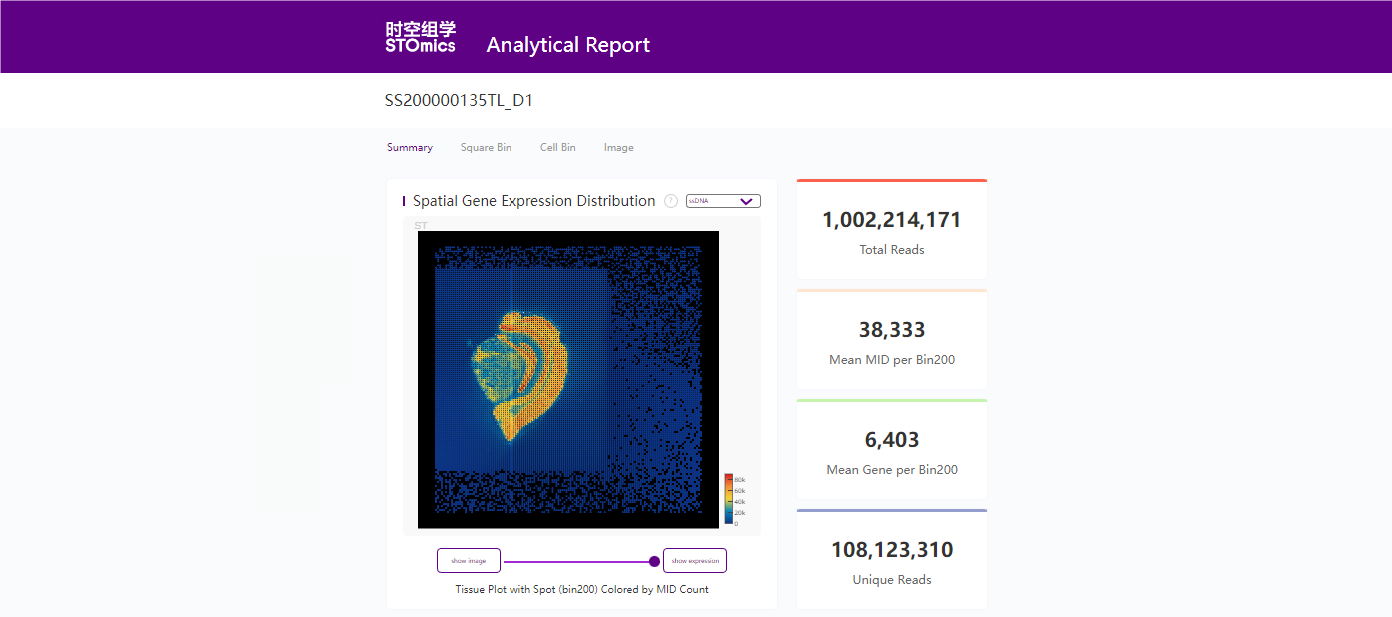
8.1 分析结果统计报告示例
bash
$ head /path/to/output/08.report/SS200000135TL_D1.statistics.json
{
    "version": "version_v2",
    "1.Filter_and_Map": {
        "1.1.Adapter_Filter": [
            {
                "Sample_id": "E100026571_L01_trim_read_1",
                "getCIDPositionMap_uniqCIDTypes": "645784920",
                "total_reads": "1002214171",
                "CID_withN_reads": "8031        (0.00  %)",
"mapped_reads": "845113606   (84.32 %)",
8.2 分析结果统计报告示例


